When most specialists read numbers, they usually take them as they are.
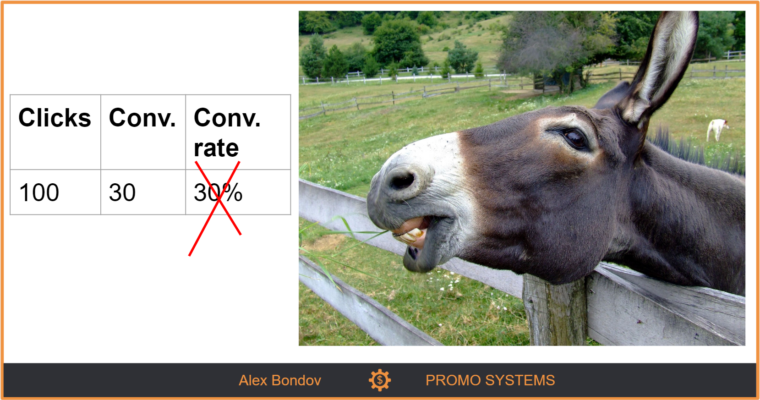
For instance, they consider 3 conversions from 10 clicks as a conversion rate of 30%.
It’s correct from the conversion rate formula point of view. But it doesn’t give you an insight into how it will behave in the future.
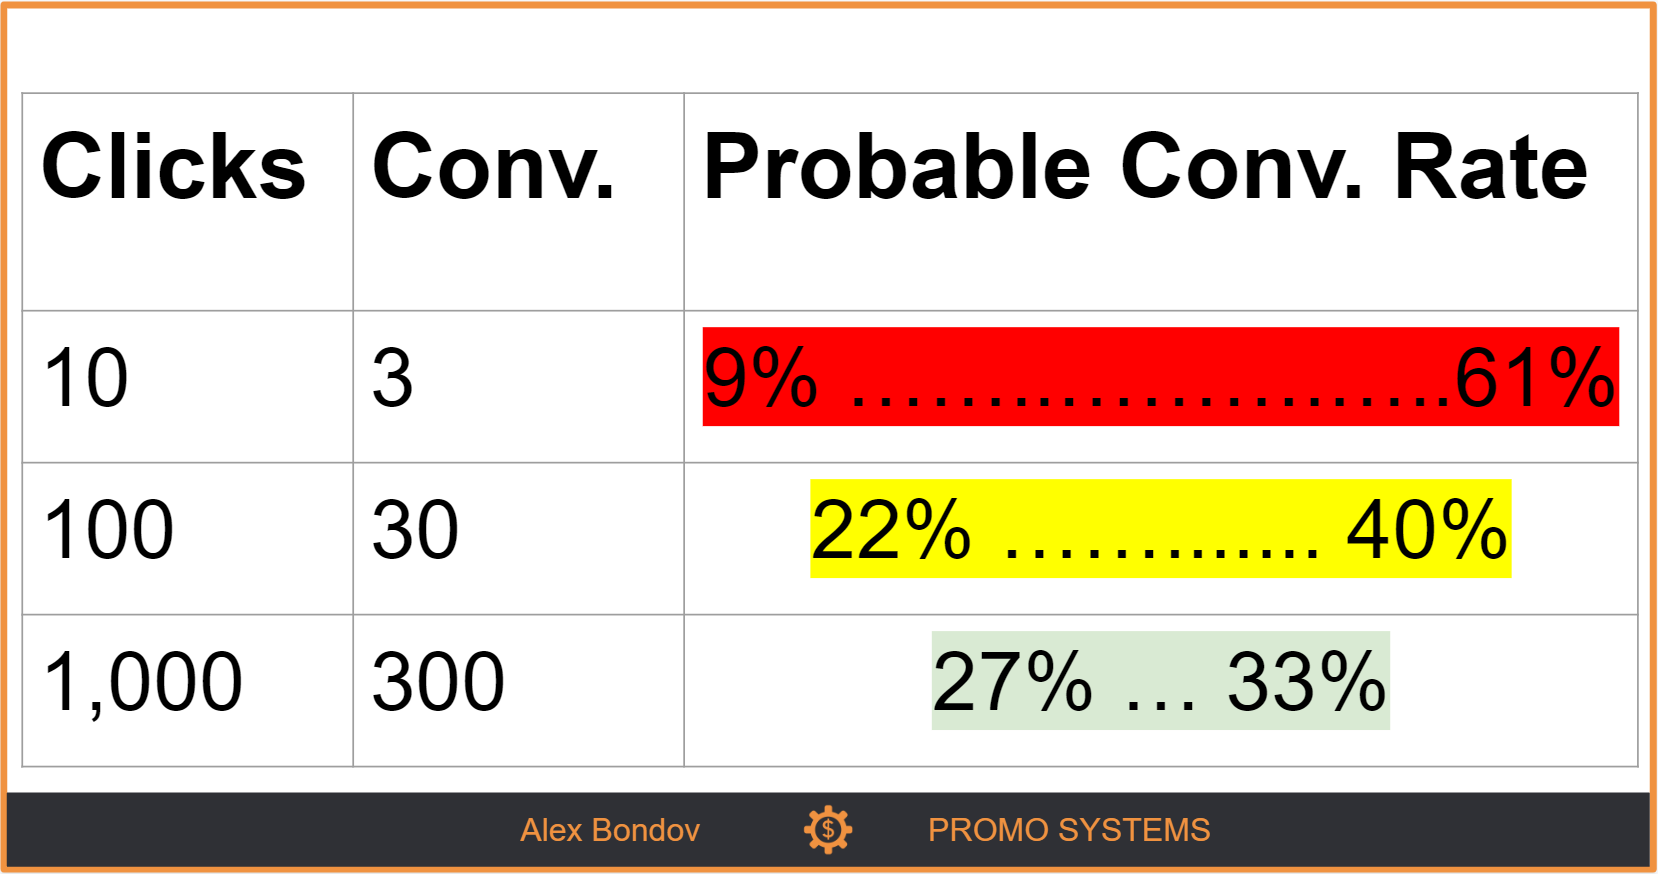
3 conversions from 10 clicks mean your conversion rate will be somewhere between 9% and 61% in the future. You should not make your decisions based on such a wide range of probable values.
Consider the conversion rate as its confidence interval instead of the average value. The range of 9% and 61% is the confidence interval.
It may sound complicated, but there are calculators for this that even a newbie can use. They are referred to as “Confidence Interval of a Proportion calculator” or “Confidence limits for a proportion”. Their output looks like this:
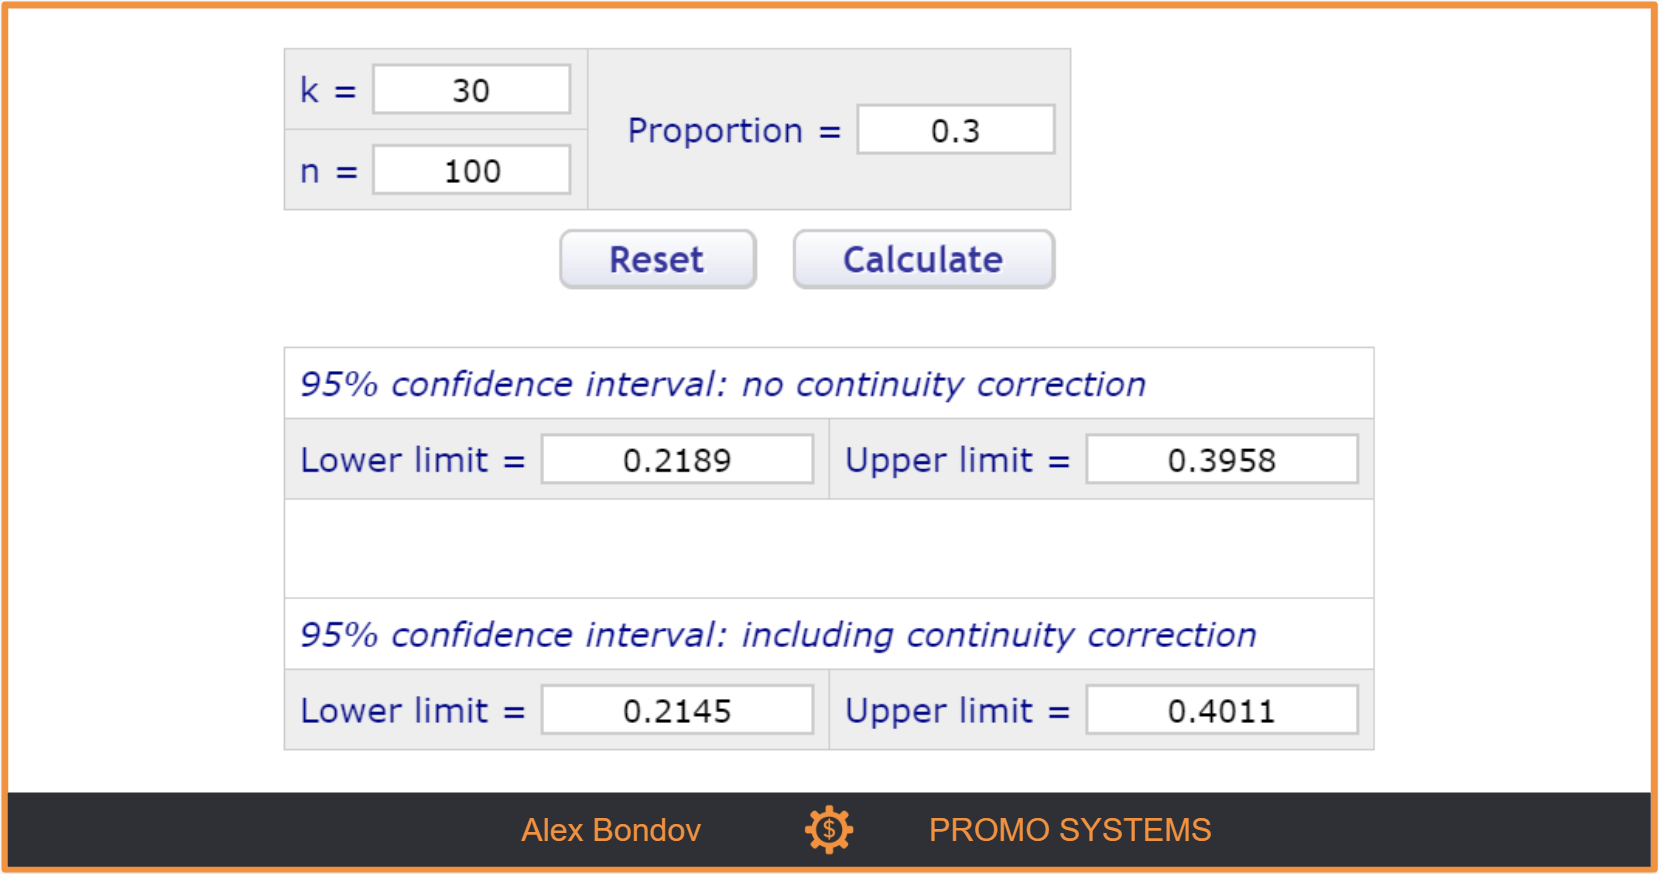
How to read this output: 30 conversions from 100 clicks means your conversion rate shouldn’t drop lower than 21% and shouldn’t be higher than 40% in the future.
Calculating the confidence interval each time isn’t really convenient, so here is a table where confidence intervals are calculated for the most popular conversion rates. All values are calculated for a probability 95%.
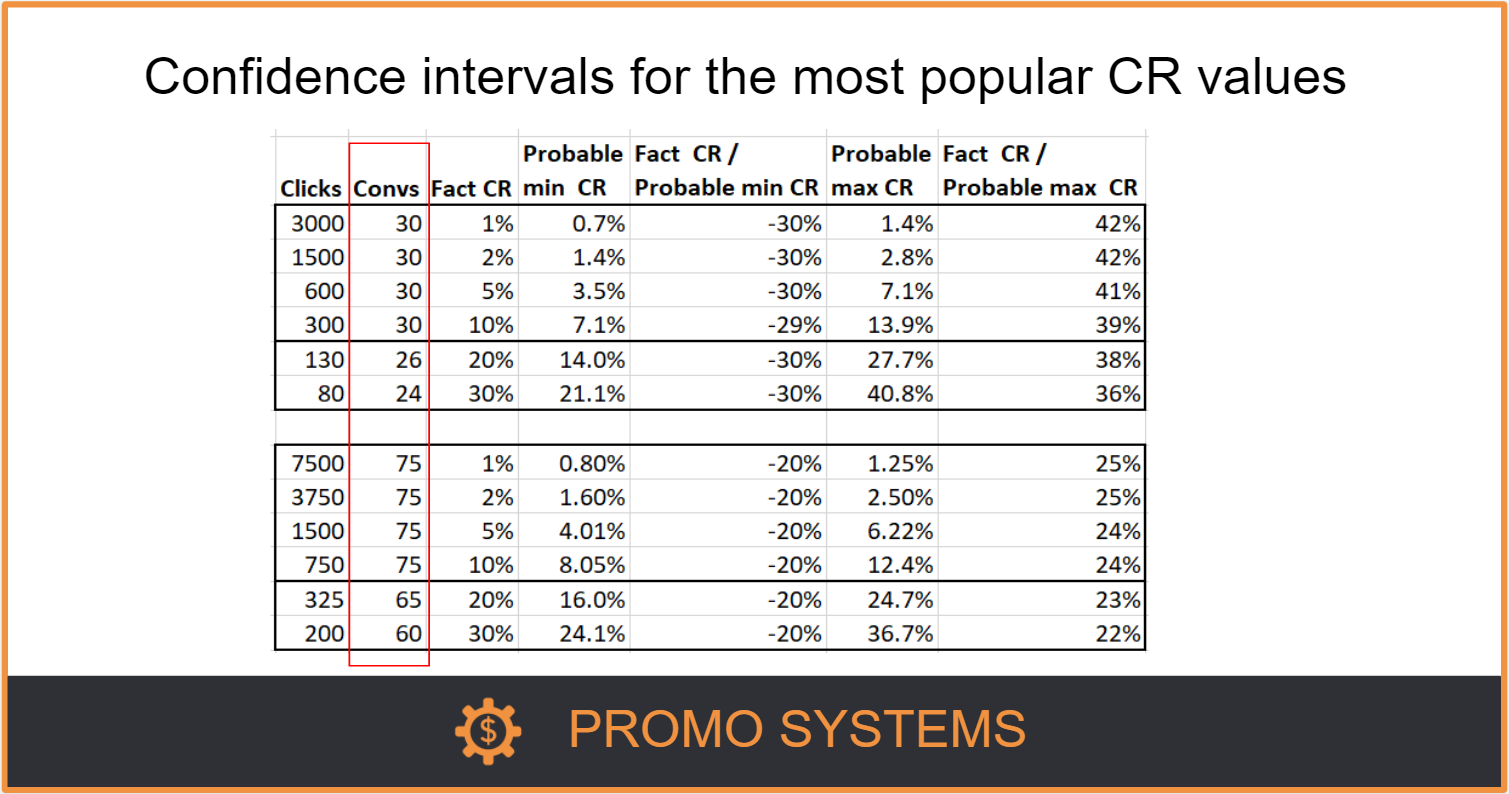
Probable Minimum and Maximum Conversion Rates mean that your true Conversion rate lies within this interval when you observe this number of conversions.
For instance, if you observe 30 conversions out of 3,000 clicks, this means that your true conversion rate is between 0.7% (which is 30% lower than the conversion rate you observe) and 1.4% (which is 42% higher than your current fact conversion rate).
Or, if you observe 75 conversions out of 7,500 clicks, means that your true conversion rate is between 0.8% and 1.25%. This also means that your conversion rate may decrease by 20% or increase by 25% with time.
Depending on the level of the risk you’re comfortable to take, you can choose, what difference between the observed and probable Conversion Rate you consider as significant enough.
And here is a simplified, actionable table for decision-making.
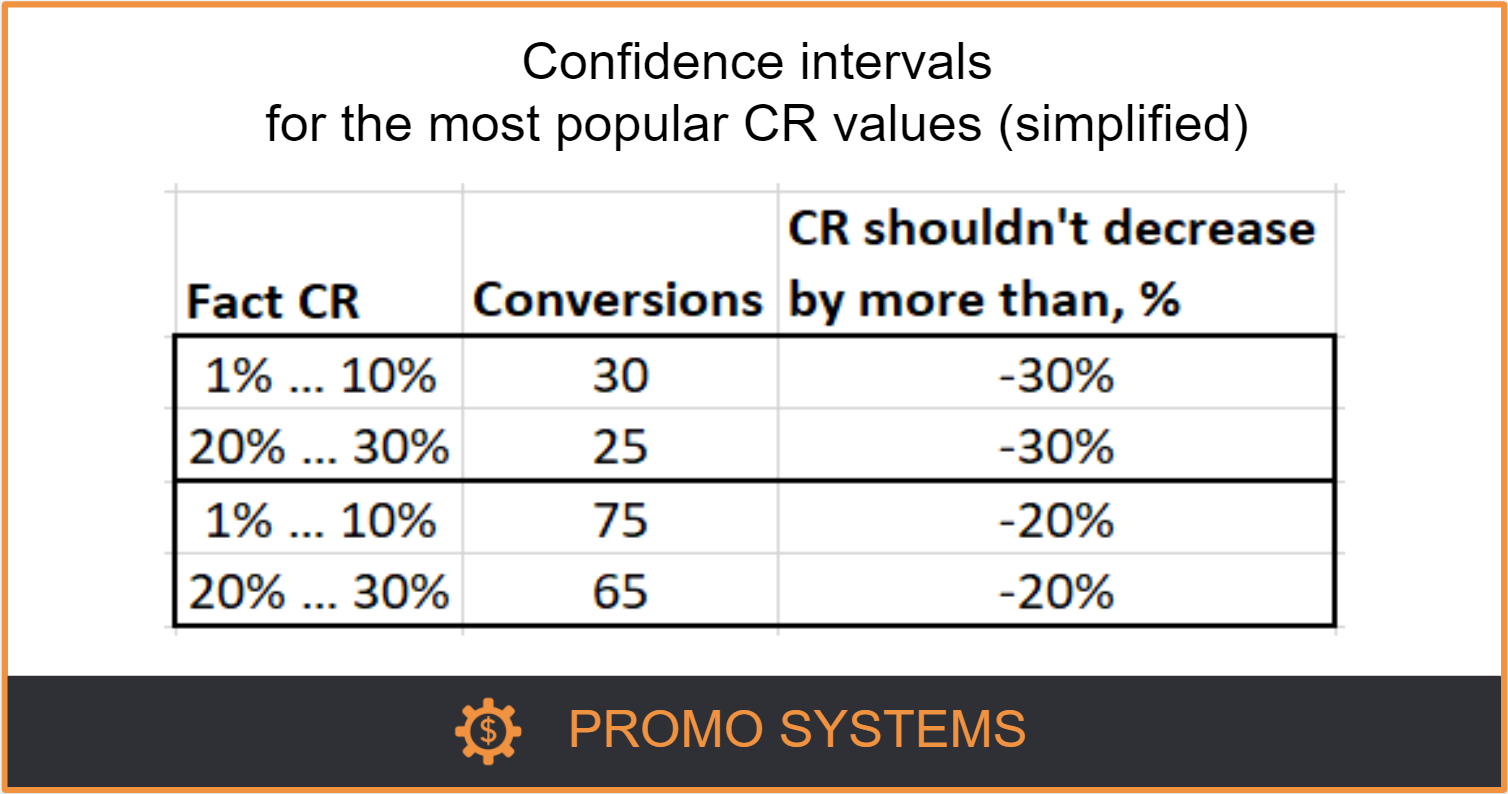
For instance, if your observed Conversion Rate is in a range of 1% to 10%, then you need 30 conversions at least to be 95% sure that the observed conversion rate won’t decrease by more than 30%.
And if the possibility of 30% decrease seems too high for you, then you need to wait until you observe 75 conversions. In this case, you can be 95% sure that the observed conversion rate won’t decrease by more than 20%.
If you need even higher precision, you can use a calculator to define the needed number of conversions. Though, you’ll need around 200 conversions per entity. And when you have such volume, you better delegate such decision-making to automated bidding strategies.
Keep in mind: this is the number of conversions per entity, like, keyword or location. It is not the total number of conversions you observe in the whole account.
So, how to tell if my conversion rate is statistically significant?
Statistical significance is not a black and white kind of thing. It’s a degree of a risk level you’re comfortable with. My approach: to make decisions when the value is not likely to drop by more than 30% of the value I see at the moment. For instance, if the current CR is 10%, I would make a decision when it’s not likely to drop lower than 7%. In some cases, I need a higher certainty. I won’t make a decision until the probable value shouldn’t fluctuate by more than +/- 10% from what I currently observe.
Use case 1: should you increase bids for a well-performing location?
Let’s say, you have 100 clicks and 30 conversions. 30% is a good conversion rate for your business and you consider increasing bids. But how to be certain that it won’t drop considerably lower?
1. Decide on a lower threshold of the confidence interval. A lower threshold means that your conversion rate is not likely to drop lower than this value in the future. Say, you’re comfortable when the value you observe shouldn’t drop by more than 20% (so, shouldn’t drop below 24%).
2. Insert 100 clicks and 30 sales into the calculator. It shows you that your CR may drop to 22% (lower limit of the confidence interval). In this case, your numbers are not statistically significant to increase bids yet. Keep it running with current bids.
Use case 2: should you decrease bids for a poor-performing product group?
Let’s say, you have 1,000 clicks and 10 sales. It corresponds to a conversion rate of 1%. And you need your CR to be 3% at least to meet your performance goal for this product group. You consider decreasing bids for this product group. But how to be certain that it won’t raise to 3% if let it run further keeping your bids unchanged?
Insert 1,000 clicks and 10 sales into the calculator. It shows you that CR may increase to 1.9% at most. In this case, your numbers are statistically significant and you can decrease bids now.
And what if you make changes based on insignificant stats?
Let’s see an example of what happens when you make decisions on changing keyword bids when stats are insignificant. Actually, this is applicable to any other entity in an ad account, be it ads, campaigns, locations, age, gender, etc.
For example, here is how your keywords performed during the first month.
Month 1
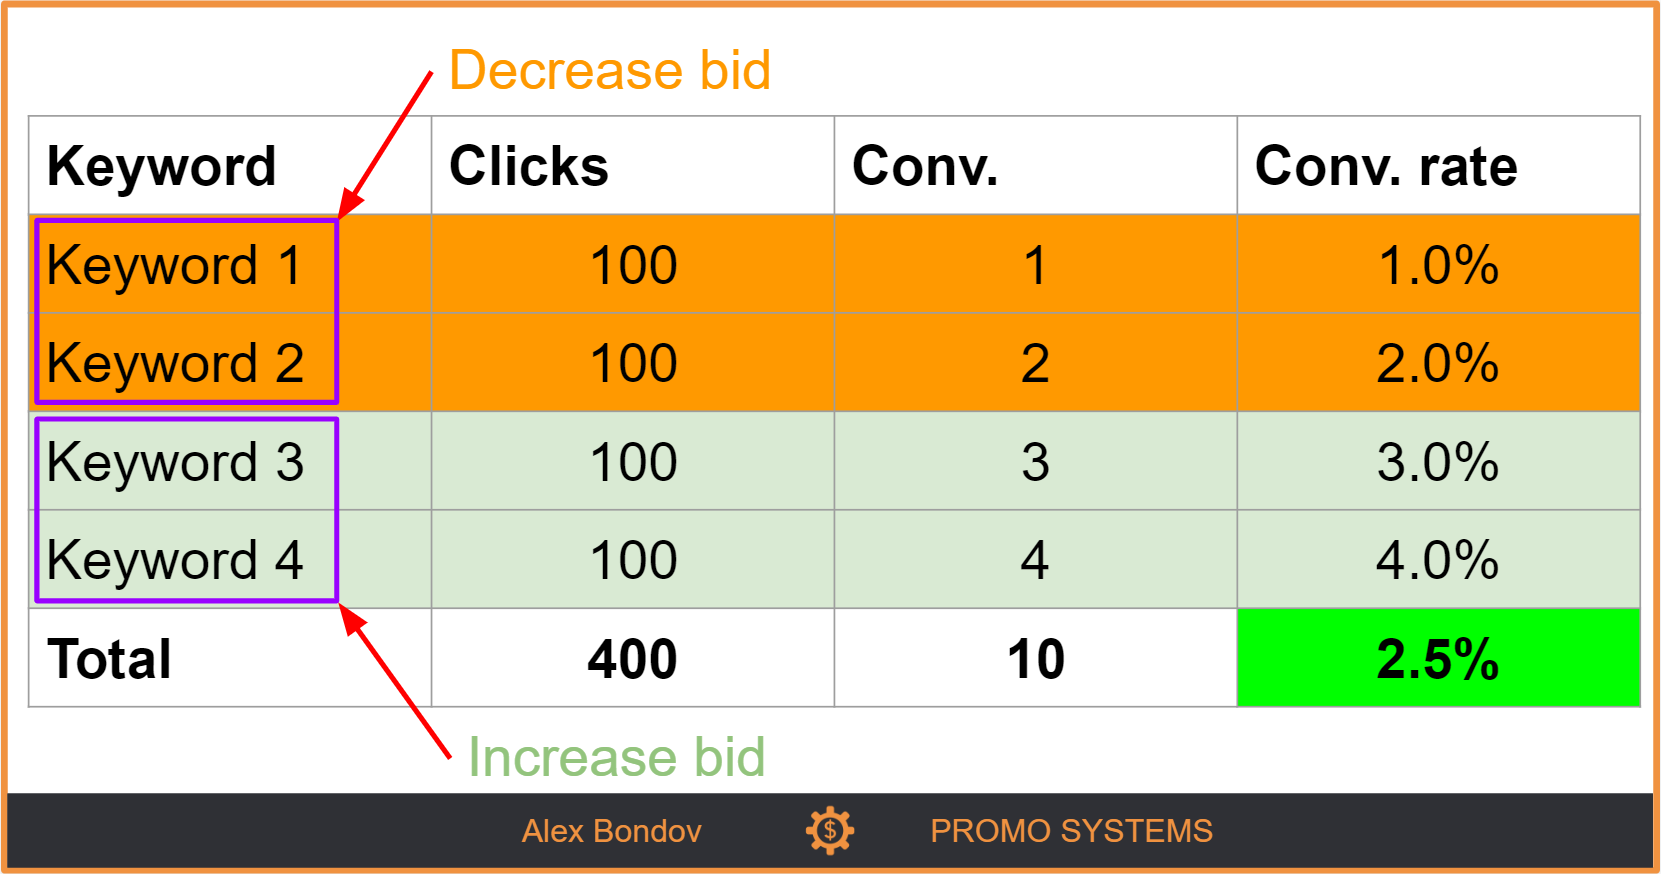
The most common response to such a situation is to:
- decrease bids for the 1st and the 2nd keywords
- and increase bids for the 3rd and the 4th keywords.
And here is what may happen the next month:
- The 1st and the 2nd keywords performed better than during the first month. But they drove a few sales. Their bid was low (due to decreased bid) which led to a low number of clicks.
- The 3rd and the 4th queries’ performances became worse than it was during the first month. Combined with the higher cost per click (due to increased bid), it made the cost per conversion too high.
Month 2
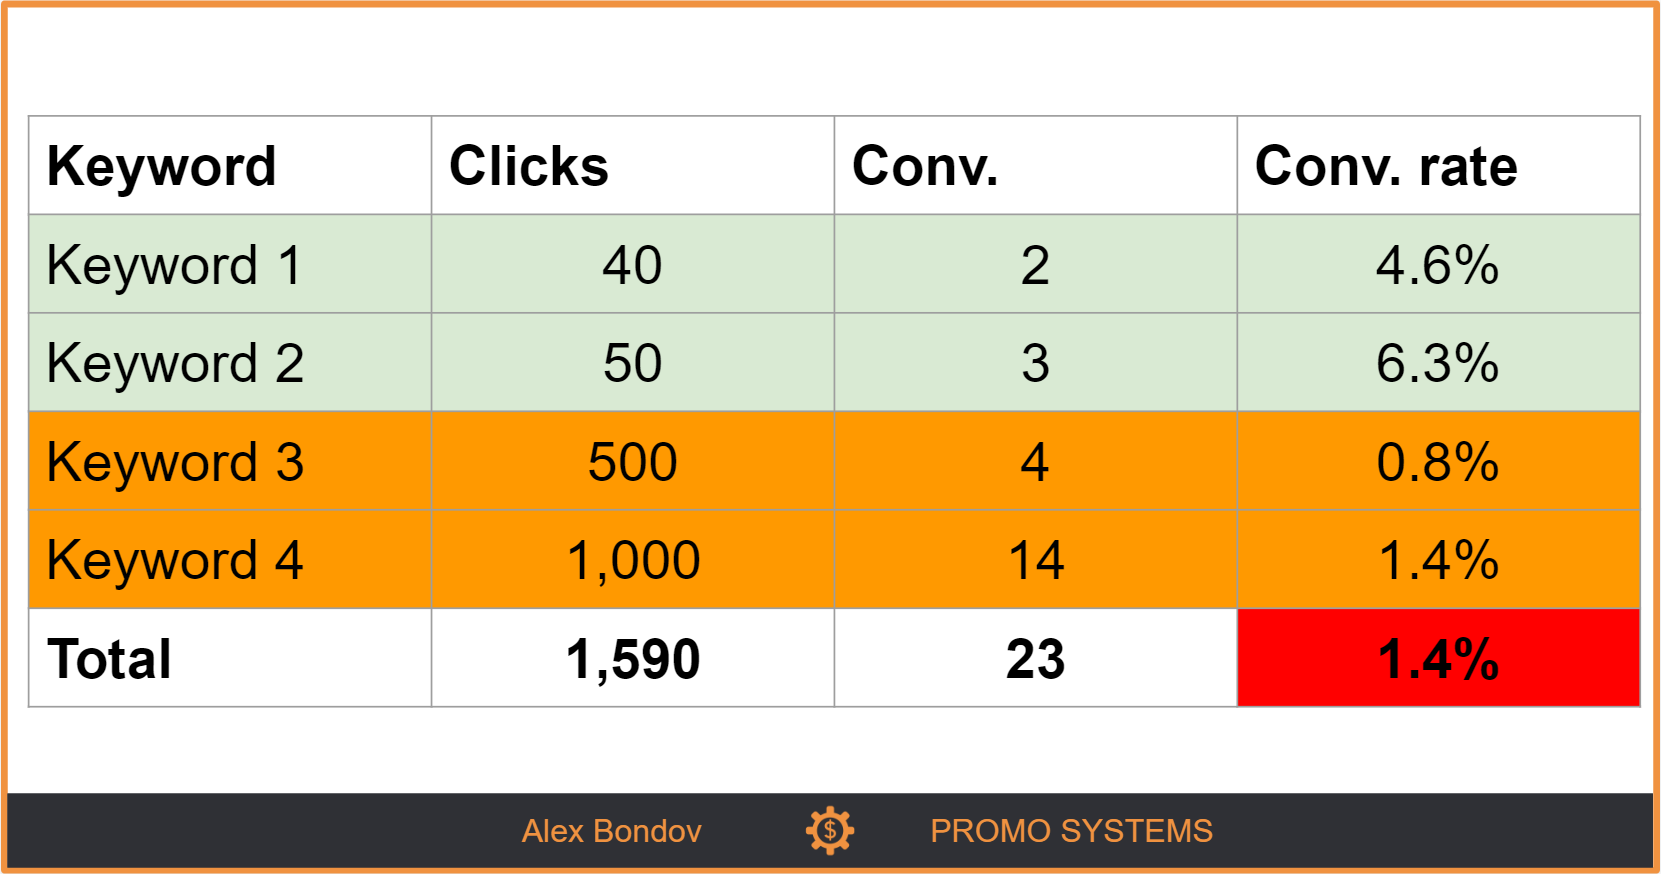
As you can see, the overall performance has decreased. Why do such things happen?
Here is what happened during the second month:
- the first two keywords performed at the maximum conversion rate of their confidence interval,
- the 3rd and 4th keywords performed at the minimum of their confidence interval.
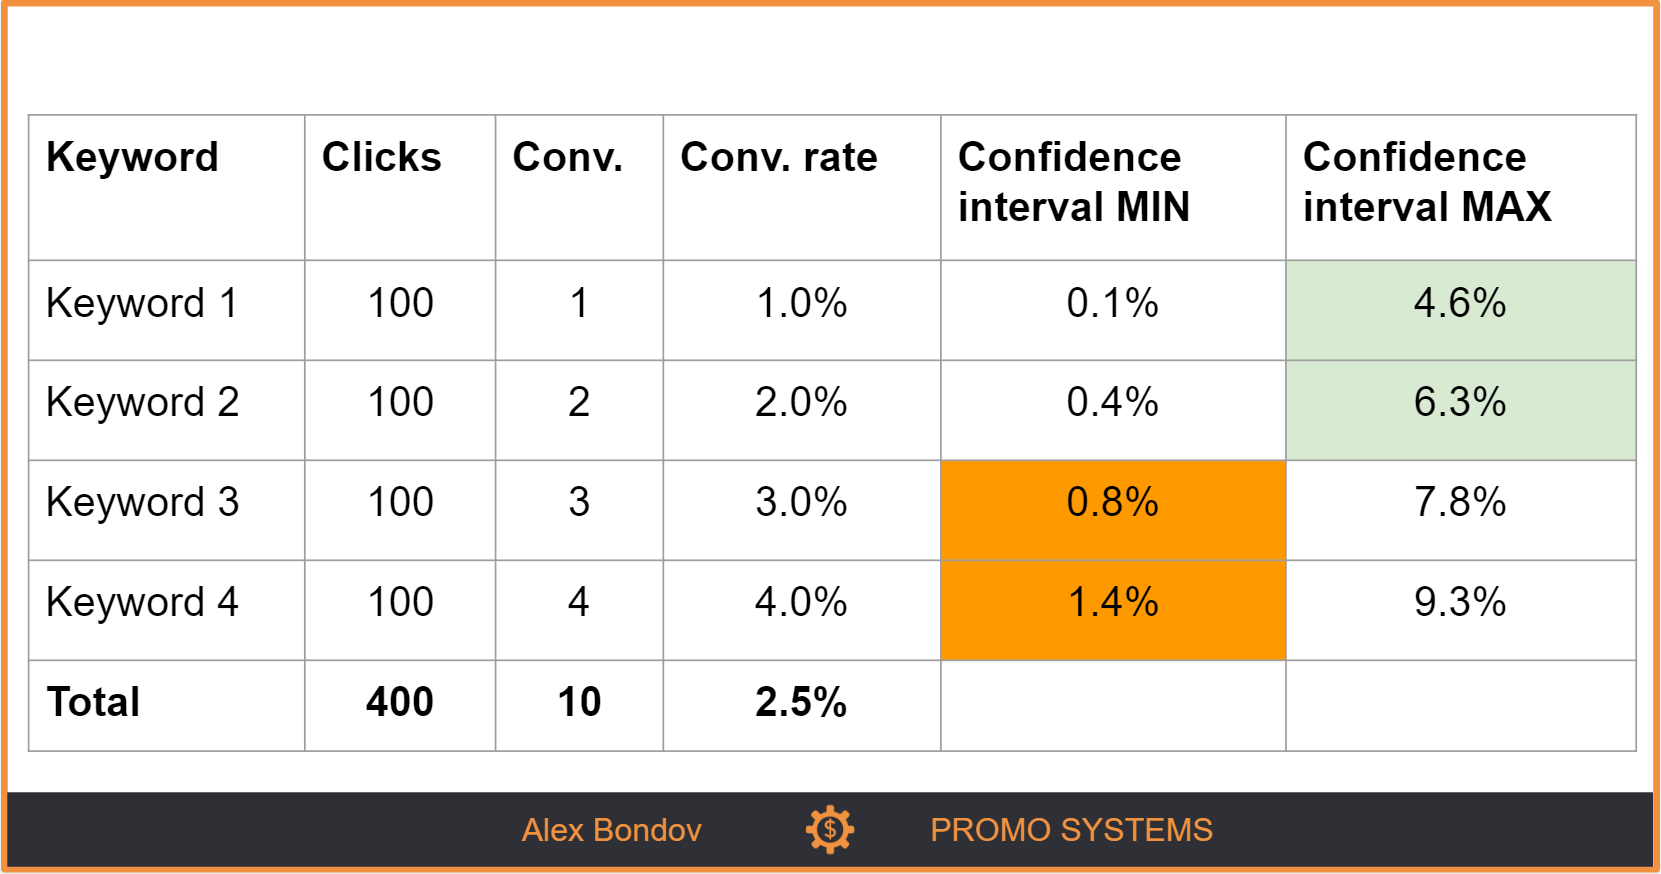
The next month it may turn the other way around, shaking your stats again. And the reason will be the same – taking actions based on insignificant stats leads to unpredictable, inconsistent results.